Category Links
Screen/Installation
Photography
Work Related
Clothing
Thesis
Main
Meredith Davey
Thesis Submitted as part of the requirements of the
Graduate Certificate in Digital Technologies in Design Art Practice
Department of Design and Computational Arts
Concordia University
September 15, 2005
Thesis Advisor: Jason Lewis
.
Below is the abstract from my thesis. The full version can be found by following the link above. This contains the full discusion and analysis of SADI, with images.
SADI: Science and Art, a Designed Interface
Meredith Davey
Thesis Submitted as part of the requirements of the
Graduate Certificate in Digital Technologies in Design Art Practice
Department of Design and Computational Arts
Concordia University
September 15, 2005
Thesis Advisor: Jason Lewis
0. Abstract.
The mathematically based sciences (applied mathematics and physics) traditionally have two modalities: mathematically based analysis & empirically based interactions. These modalities are seldom experienced at the same time. Both of these modalities are highly developed in terms of their use, structure and presentation. While there has been recent work done to manipulate these modalities in original ways there has been little or none to try and integrate them.
In these fields mathematics is used to describe and extrapolate from a physical object or system, visual analogies or links can be easily made, although the visual aspect is lost in the mathematical analysis.
This paper examines the modalities and makes proposals for why they should be integrated, laying some basic foundations for a new visual language to be developed for these fields. This language is a new modality that expresses both the analysis and the visual representation of the analysis at the same time. Additionally, this paper presents and evaluates SADI (Science and Art: a Designed Interface), a prototype system that demonstrates this new modality as a combination of the two traditional methods. One of the aims of SADI is to make the use of applied mathematics intuitive and, to some degree, tangible.
A lose framework of development for this language is also laid down in this paper.
1. Introduction.
The scientific method is separated into two modes: empirical and analytical. For the sake of this paper we will consider physical & computational experimentation as well as the simulation of physical systems as empirical. We will consider analytical to be the mathematically based description of these objects. Such descriptions are either derived from the interpretation & interpolation of empirical results or derived from theoretical investigations.
We make this distinction to highlight the different principals behind empirical and analytical scientific methods. The empirical mode focuses on a tangible or virtually tangible (in the case of simulations) interaction with a system, exploring its scope and properties. The analytical description of this system, while stemming from this interaction, is valid without any direct contact to it. This allows people to understand the basis and principals of a system without any direct exposure to it.
There is still a strong link between the two modes, for while investigations may take place primarily in a purely analytical mode, they are either instigated by or lead back to empirical observations. The link between the two modes is not necessarily made by the same people. This can be shown by divisions within academic departments into theoretical groups who focus purely on analytical investigations and empirical groups whose research goals are motivated by extending the empirical limits. Furthermore there are groups that combine both schools of thought, where this feedback between modalities is more immediate although there is still a separation of modalities when the work is undertaken.
These two different modes require different methods of describing and analyzing an object. One is based on directly observing the object itself and the manipulations of the object and the other stems from a mathematical derivation of its actions. It is akin to a situation where you are asked to describe a series of objects in detail by first feeling them while blindfolded and then looking at them with your hands tied behind your back. Descriptions are then kept separate for the different modalities. While a composite complete description can be formed, it is obvious that this is not the easiest way to describe the objects.
It is clear that combining the two modalities of empirical and analytical into a common frame will allow for greater perception of the systems for a user of this new language. By allowing the user to evaluate both modalities at the same time, without resorting their internal mental framework, will make the connections between the modalities readily apparent. This will have impact in both the methods of pedagogy and research, strengthening the bonds between modalities and allowing for greater and transparent understanding of the methods involved. It is clear that this new modality will be a highly graphical one either in terms of display or embodied objects.
Computational display provides us with the best option as a platform for developing this language. While there is scope for making traditional media achieve the same ends, it is unlikely that these will be of any significance or complexity when addressing the physical sciences.
As a demonstration I inscribed a tennis ball with the Newtonian laws of motion. While these are valid for certain assumptions, it becomes impossible to show the whole analysis for this ball simultaneously as this would lead to inconsistencies of description. This is as the analysis for the ball in motion will not be identical to the analysis for the ball at rest. Additionally it was clear from this demonstration that such a physical form was not well suited to this language as the text was both hard to read when the ball was in motion and difficult to follow on the curved surface when at rest.
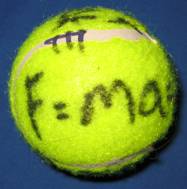
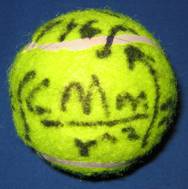
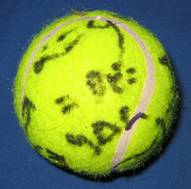
Figure 1. Demonstration Ball – Meredith Davey, 2005.
3 views of a ball inscribed with the Newtonian laws of motion. This was made to act as an embodiment of mathematical analysis on the object that the analysis describes.
While this demonstration showed that static physical objects would be difficult to encompass in this language it also highlighted the effect of presentation and aesthetics on how this knowledge would be displayed. When forming this language it would seem aesthetic connotations become one of the founding blocks of the design. This view is echoed by Rand and Maeda, Rand[1] states “Visual statements … which do not involve aesthetic judgment and which are merely literal descriptions of reality can be neither intellectually stimulating nor visually distinctive.” and Maeda[2] emphasis the problems with literal translation of mathematics into visual forms “Mathematics by itself is indeed an art, but it’s direct translation to visual representations does not necessarily result in art of any value.”
From the previous example it would be fair to say that computational media offer (at present) the best way to model this solution, from both executable and conceptual standpoints. Modern consumer level computer hardware and software allow for fast real time manipulation and augmentation of a media stream at relatively low cost. This allows for ready uptake of the system without expensive or bespoke technical platforms needing to be developed.
A prototype system, called SADI, has been developed to show and example of how a new language can be formed embodying both modalities into one. SADI stands for Science and Art: a Designed Interaction. This was made to be an initial study for the new language based upon the rules stated in section 3. It was designed to act at a high level system description and simulation model using typographic means to illustrate both the analysis and the simulation. SADI was installed in May 2005 as part of the public group exhibition “You are Here” in Montreal, Canada.
2 Motivation for research.
2.1 Personal Experience.
My training was in physics, specializing in quantum theory. I learnt physics and the associated analyses by forming mental images of the processes being analyzed. These visualizations were sometimes reflected in external work, although seldom used in the analysis on which they were based. The exception to this is Feynman’s Feynman Diagrams[3] where the visual layout plays an important part of quantum analysis. Through this experience I became convinced that there were other ways that mathematically based physical analysis can be done, embodying a visual link between modalities of analysis.
After my training, I moved professionally into engineering, working by extrapolating knowledge from the domain of physics to that of buildings. When completing analysis for engineering, there were several methods and tools based upon the idea that you could create a visual, but thorough, analysis. These visual methods, while useful, often did not lend themselves to being used as a substitution for mathematical analysis. But the principal of visual linkage to the analysis remained strong.
In both these domains the tools used for mathematical analysis often relied upon iterative steps: making an entry, hitting return and waiting for a result to appear. This further separates users from the other modalities of the subject they were analyzing. Allowing this development to happen in real time, and having the other modalities of this analysis incorporated into the visual output is something that can be done mentally (i.e. without external assistance) but is not currently supported by any tool.
Lewis, in the second chapter of his masters thesis[4], discuses the content lag with new medias and the gap that occurs before interesting and new expressions are made upon them. At present, most computational tools are based around traditional methods of expression and assistance, either in layout or in terms on numerical/symbolic computation. These applications make it easier to produce work on a traditional basis but do not compliment, only assist, the understanding of the mental process that is involved in working through an analysis of a physical system. This is a laudable application for the development and use of computers, but it has now been close to 60 years since computers were used for physics research with the ENIAC[5] machine. In this period there still has not been any significant new expressive application of physics to the computational domain that retain the analysis (visually) that they stem from.
My aim is to produce a system that can give meaningful analysis and results that incorporates the temporal and modal aspects of a mental approach to the same issue.
2.2 Methods of Mathematical manipulation.
To understand the scope of this project it is useful to understand the current common ways of presenting mathematical manipulations. I focus on discussing computational methods, but it should be noted a very common form of working with mathematics is with paper and pen or chalk and blackboard. As we have seem from my previous example, of the tennis ball (see section 1), a computational platform will be the most versatile solution and therefore will focus on tools in this medium. I also discuss current innovations in the visualization of scientific results.
2.2.1 Text based tools
There are two types of text based tools: a) compositional and b) computational. Tools of type (a) are used to compose mathematically based text on the page or screen as clearly as possible, while tools of type (b) assist in the calculation & manipulation of the mathematics.
2.2.1.1 The leading layout tool for mathematically based documents is TeX created in 1978 by Donald Knuth[6]. It was formed by Knuth to act as the best possible layout mechanism for mathematically based text documents. TeX is a scripting language that works well to adapt the subtleties of hand written mathematics into a page layout that can be printed or transferred digitally. TeX is most commonly used in the form of LaTeX[7], essentially a packaging of common macros around a TeX core.
Knuth’s efforts in this area are worth applauding and have proved very successful in forming a well defined typographic layout mechanism for these types of documents. A large majority of journals, for instance, will only accept documents prepared in (La)TeX format.
A weakness of TeX is that it provides no computational assistance while using it. This restriction limits TeX to the presentation of pre-formed works. As such, there can be no reflective cycle between the user and TeX-based documents, limiting its usefulness as a pedagogical tool.
TeX also has no ability to visualize the mathematics that it is being used to write, apart from basic vector illustration. To use TeX it requires the separate rendering of images that are then embedded into the TeX markup. Additionally, rendering complex mathematical images can be highly computationally intensive and this may have prevented image generation integration to TeX. The limitation further makes a conceptual separation between the analysis and the visualization of the same subject.
There are other packages that offer a layout element in addition to computation assistance (see 2.2.1.2 and the discussion of Mathematica), although they tend to lack the visual strength of TeX. We can only imagine what the possibilities would be today if TeX had originally been developed to additionally offer computational support and visualization assistance.
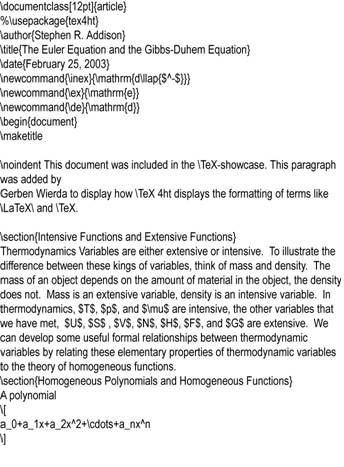
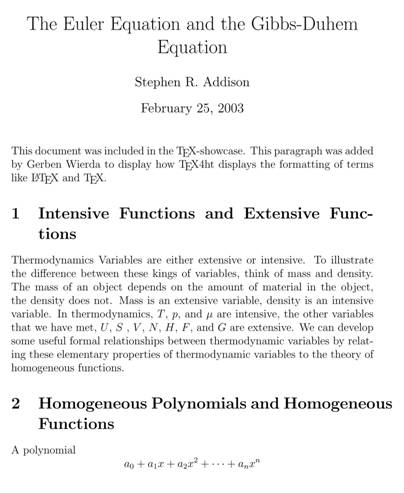
Figure 2. TeX Example – Addison and Wierda, 2003.
This example of TeX shows the TeX script (left) and resulting document once processed (right). NOTE: the script showed is the snippet corresponding to the displayed image, and therefore does not include the closing clauses for a document. This example was taken from the TeX Users Group (http://www.tug.org) and was created by Addison and Wierda.
Other tools are available for compositional laying out of this kind of document and range from standard word processing programs to vector illustration packages. Both of these options have inherent problems.
While word processing programs (notably Microsoft’s Word) have had the ability to set mathematical text since their early graphically focused versions, it is often difficult to do so. This is both in part due to the limitations of the plug-in tools used and the inherent lack of high level page layout abilities with such of programs.
Vector based tools often do not have good support for this kind of layout due to their lack of support for non-standard characters. For instance, only the latest versions Adobe’s Illustrator have had the ability to use extended character sets. These are vital for documents that contain strong element of mathematics due to the nature of the text being set. See sections 4.3 & appendix A.1.1 for my discussions of typography & font face selection for SADI for a better description of this issue.
2.2.1.2 The other type of text-tool is one that can use the contents of the document as computational input. Such tools can be further divided into two types: i. those that support and open architecture for mathematical notation and ii. those that illustrate single simulations. I will briefly outline the type ii. applications and then move to a thorough discussion of type i. applications.
Type ii. applications tend to be made for web-based environment using either Java or Flash’s Actions Scrip. These present a static equation that has input boxes for numerals to produce a numeric response. These often shown in association with graphical representations of the systems they describe.
While these works may have certain limited pedagogical benefits they are limited by essentially acting as pre-programmed calculators. They do not tend to offer any new or interesting views to this work and instead act as ease of use learning tools.
Type i applications can evaluate mathematical expressions in abstractions. Not in the sense that they use abstract terminology, as Mathematica for instance can use standardized notation, but that the use of such tools requires no knowledge of the function, just its identity. Additionally these applications require additional steps, over mental manipulation, to show deeper aspects of the mathematics. By requiring these additional steps a concreteness of thought is induced that is not necessarily inherent to mental manipulation.
Programs like Maplesofts Maple and Wolfram Research’s Mathematica allow for the open evaluation of mathematical expressions and are therefore classed as type I. These programs allow for manipulation based on mathematical identity and numerical calculations. Mathematica and Maple are the two current leading programs used for symbolic mathematical working and have been optimized for this. By this I mean that there are other packages (e.g. MatLab, bespoke written code etc) that perform better for numerical calculations but do not have the same freedom of working based upon un-evaluated mathematical expressions.
While Mathematica and Maple both support the ability to type set equations well they fail to be used by any significant number of people to create full documents. This is due to the difficulty in both laying out a document in this way and ability to directly write in these tools the non-mathematical parts, typically English prose, of an analysis.
One of the drawbacks of type i. systems is that they require explicit instructions to evaluate the object being described. To take a basic example: the trigonometric function Sin(x) has a basic but familiar visual ordering. Sin(x) is one of the first standard functions that students are taught and therefore anyone trained in the field has an understanding of its form. To get Mathematica to show this inherent visualization requires the following (pseudo)code:
Plot[Sin[x],{x,-10,10}];
Or
aFunction == Sin[x];
Plot[aFunction,{x,-10,10}];
The reason why I have included the second form of the plot function is it allows the further (or previous) manipulation of the function plotted while the first will simply plot Sin(x) in abstraction. The other important point about this demonstration is that it requires you to specify a specific range for the function to be drawn over (in this case -10->10).
Forcing a user to specify that the program should produce a visualization, that is not purely typographic, and specifying a domain for this visualization requires a level of concrete thinking that is not necessarily appropriate to abstract thinking. By concrete thinking I mean that the function when thought of mentally does not necessarily have any bounds or limit but a user is forced to select such when using this type of tool. This separation to a mental form of working is further reinforced by requiring the user to make additional and explicit requests to form visualizations of even trivial functions.
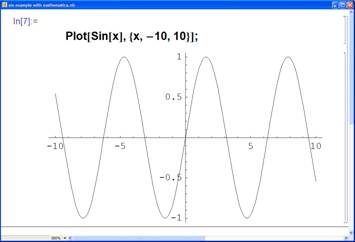
Fig 3: Example of Mathematica Interface.
In this instance a Mathematica notebook is being used to plot the function Sin(x) over the range -10 to 10.
Sha[8] briefly discusses a similar topic in his Phd dissertation, examining the case of the difference in Maple between sin() and Sin() where one is computed as the identity sin the other as a floating point calculation. He uses this point to highlight the difference between how a mathematician and a programmer view the same function in different ways. Sha addressed this issue, for the domain of differential geometry, with the Geometers Workbench which allowed for gestural based mathematical exploration[*].
This also supports my argument that using traditional computational means a forced concreteness of thought is introduced because of the language support by the tools – in Sha’s example requiring the differentiation between a floating point and a symbolic function to be used in their analysis. This concreteness reduces the ability for the physicist to grasp and manipulate all aspects of the analysis at the same time.
2.2.2 Graphical Tools
Computational tools that are aimed at producing graphical results rely on either an explicitly derived parameterized algorithm or a large data set to be able to convert into a graphical representation. Both of these options require a firm definition of the object being visualized, either though a clearly defined algorithm over a set domain or from data generated from a computational or physical model. In none of the applications that I have surveyed was the analysis creating or stemming from the visualization incorporated into it.
Possibly the most commonly viewed computational physics system (although the number of direct users is relatively low) are weather models[9]. These use a statistical physics model to predict weather patterns and for ease of clarity derive a graphical output, usually linked to geographical information. The fundamental physics that derives these simulations is seldom or never shown alongside weather predictions, so making modern-day meteorologists akin to a Victorian magician who doesn’t reveal how an effect is achieved.
The British Metrological office runs its numerical model, termed Unified Model[10], through the Hadley Center. This is an involved and multilayer simulation that runs on some of the world’s fastest supercomputers producing a numerical solution or prediction. These are then often converted into graphical results for ease of understanding. So the only interaction that the vast majority of users have with this model is through simple maps generated to show short-term weather predictions.
Sha’s Geometers Workbench[11] provides a computational sketchpad for mathematical geometry research. This system works by taking gestural input and feeding it to Mathematica and then rendering the result as an OpenGL image. This image is then back projected at high definition onto a large vertical surface that the user can draw on with an electronic pen. One of the aims was to allow the freedom of expression that is possible for a blackboard to be used with this system.
The Geometers Workbench operates by taking users’ freehand input and mapping in real time this to differential geometrical functions allowing for exploration of ‘geometric space’ aided visually by computational assistance. Working in real time allows for rapid examination and experimentation through these computationally rendered geometries by the mathematician. This system is designed to allow high level and expressional gestural input to create a low level mathematical result.
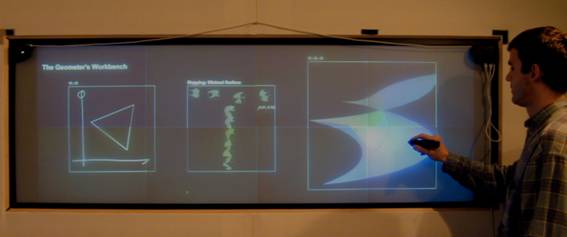
Figure 4. The Geometers Workbench by Sha Xin Wei.
This image shows a user of the Geometers Workbench system, gestural input is transformed into mathematical actions. SOURCE: Francois Guimbretiere, Terry Winograd, Sha Xin Wei; "The Geometer’s Workbench: An Experiment in Interacting with a Large, High Resolution Display", Technical Report, Stanford Computer Science Department, 2001.
Chak & Ishii’s CircuiTUI[12] has been developed on the SenseTable[13] device to explore electronic circuits by continual computational modeling of the physics behind user defined circuits. The SenseTable is a top projection system that projects on to a horizontal surface where smart objects (physical tiles with embedded electronics) are placed and tracked computationally, these objects can additionally be directly projected onto allowing for virtual re-definition. In CircuiTUI the objects represent circuit components that can be directly interacted with by a user in a virtual circuit arrangement. The circuit simulations are rendered graphically and projected close to, or on to, the circuit components on the table. This acts a virtual empirical workshop.
Zuckman[14] describes it as “The CircuiTUI application is currently used in an educational setting at a university level introductory course to circuit design. The Sensetable platform enables modeling, simulation and presentations of dynamic behavior is a variety of fields, and has great potential as an educational technology.” At present just the graphical results of the simulation are shown, but the system offers hope that the analytic description can be shown alongside its simulation instead or in addition to it. Allowing for the presentation of the analysis and the simulation in this way would enable greater connection to be made between the two, rather than the purely virtual empirical experience currently offered.
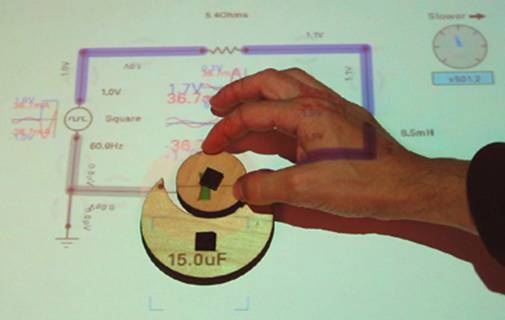
Figure 5. CircuiTUI by Chak & Ishii, Undated.
This image shows the CircuiTUI in use by a user. The manipulation of the smart object affect the circuit simulation and results are directly projected and viewable. Image taken from MIT’s project description page:
http://tangible.media.mit.edu/projects/circuitui/
2.3 Methods and Examples of Scientific Visualization
Traditional scientific visualization separates the viewer from the data. This separation was necessary before computational infrastructures were available to allow the viewer to also become a user, i.e., able to interact and effect the visualization. In the days before computational media were readily available, separation was partially addressed in typographic works.
If we compare Newton’s & Leibniz notation for calculus and Schrödinger & Dirac notation for quantum physics we find that, while these offer the same analysis, they differ in method quite substantially. Additionally, in the case of quantum physics, the two notations would tend to focus the user on different aspects of the particles (wave-like properties or particle-like properties).
While there is much controversy over whether Leibniz developed calculus independently of Newton or not, it is clear that the current notation for calculus stems form Leibniz[15]. Leibniz was said to spend weeks thinking about the typographic notation for new mathematical concepts. It can be argued that Newton, stemming from a more empirical background then Leibniz, created his notation as a way for him to solve immediate problems and therefore it lacked the flexibility of Leibniz’s formulations.
Leibniz’s notation also proves to be related to a methodology of how you would process the calculus with the symbols being related to each other for the processes, instead of providing an abstract symbol to inform that something will be processed. And from this it is argued that English analysis was held back until the common uptake of Leibniz notation in the 19th centaury.
Diracs development of the ket and bra notation for quantum mechanics acts to visually and conceptually identify a particle (it would almost be flippant to say these bracket the particle). The use of the Schrödinger without these symbols leaves the particle typographically unconstrained within the notation and therefore lends themselves to a further expansion into the wave equations. With these notations forming the bracket, it becomes easier to think of the more particle-like elements such as spin.
![]()
![]()
![]()
![]()
Figure 6. Mathematical Notations.
This figure illustrates the four nation methods discussed: Leibniz, Newtonian, Schrödinger and Dirac. Top row show notations used in calculus utilizing the Fundamental Theorem of Calculus as the subject. Left is Leibniz differential notation, right is Newton’s notation of fluxions and fluents. Second row shows the Schrödinger Equation in two notations: left is in Dirac’s ket-bra notation, right is in classical notion.
NOTE: On both rows these notations describe the same mathematical relationship.
So the typographic setting of mathematical concepts is both related to their use and how too they are semantically analyzed. This applies both beyond a pedagogical sense but in the actual epistemology and practice of the applied sciences. From these two examples it is clear that while the notation describes the same things, the notation itself has an impact on the development of the fields that it is used for and the conceptual manner in which it is thought about. And these examples show that the typographic basis of the sciences is well developed and should be added to instead of being replaced. Proposing a system that disregarded these methods, would in all likelihood, result in a substantial loss of usability and clarity.
The advent of readily-available computation in the latter half of the 20th century has seen this separation of modalities dissolve in other fields. Genetics research has driven a substantial amount of innovative representational work. A large part of this is due to the complexity and size of genomic data and structures, requiring new methods of evaluating and analyzing this information. While there are many systems that offer original methods of demonstrating scientific principles I am going to limit my discussions of examples to only discuss 3 of the most relevant.
One of the most promising projects to combine tangible manipulation of data is that developed by The Scripps Institute[16],[17]&[18] to analyze molecular biology. This system comprises both physical objects made by rapid prototyping and virtual proxies of these objects created through the ARToolKit developed by Kato, Billinghurst & Poupyrev[19]&[20]. The system offers new ways to examine complex objects utilizing direct physical interaction augmented by computational assistance to reveal a deeper level of complexity than would be possible with a purely physical object.
Benjamin Fry’s work on Genomic Cartography[21] deserves a mention in this section due to his highly developed design sensibilities when approaching what is essentially a scientific problem. The emphasis of this work is on the visualization of large, temporal, data structures but he has done some work examining the basic visual language of the field.
In this example Fry is essentially trying to create a kind of periodic table for the basic elements of DNA. In doing, so he is using knowledge from one domain of science (chemistry) to create a well designed piece of information for another domain (biology). Fry’s work in this field is visually interesting, and shows that new visualizations are not only possible but can be informative and aesthetically pleasing as well. Fry limits his work primarily to large data structures, using them to create visualizations from algorithmical analysis of them. As such, this work does not transfer well to the creation of a visual link to a symbolic language, which is one of the central issues in creating a new language for the physical analytical sciences.
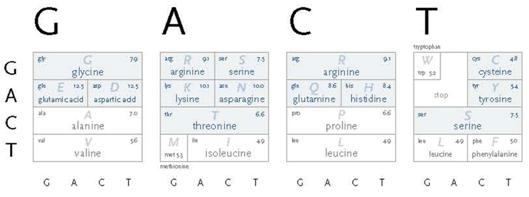
Figure 7. aasd: the amino acid secret decoder – Benjamin Fry, 2002.
Diagram mapping nucleotide sequences to the amino acid they encode. To be read counter clockwise. Taken from page 5 of Genomic Cartography by Benjamin Fry, MIT 2002.
While the examples I have shown of biomedical sciences are interesting they tend to avoid one of the central concerns of my work by sidestepping the precise mathematical description of the interactions being shown. Wolfram[22] discusses analogies to pure physics of his cellular automata experiments, but while these produce a very visual result this only further adds to the separation between the analysis and the analyzed.
Adding additional analogies like these does not help to define the analysis but can, perhaps, help people to understand the analysis, but at the cost of separating themselves further from the analysis itself. In other words showing people a pear can help them to understand an apple, but the only way to define the apple is with one.
The only cellular automata programs which I know of that directly simulate physical experiments are involved with solutions of the Navier-Stokes equations through Computational Fluid Dynamics (CFD). These simulate fluid mechanics of a complex system repeatedly until solutions converge to an answer, and so therefore could be likened to a statistical simulation. This statistical element, coupled with the high level of complexity associated with these systems, makes the link to the mathematical analysis difficult to comprehend for the user.
That is not to say that Wolfram’s research, and that of others, is not relevant to this work as cellular automata experiments produce a visual language that is both analytical and descriptive for itself. By this I mean that the rules of the system can be both described in a visual or textual manner without increasing the description complexity or length. One of the reasons for this is that the systems are inherently visual in design, like for instance John Conway originally developed his Game of Life[23] on a Go board in the 1970s. The system rules tend to be simplistic, but create complex results after multiple iterations.
3 Summary of Challenge.
Most computational systems are used for their problem-solving ability or their typesetting ability, additionally many graphical systems for problem-solving separate themselves from the mathematical analysis or are not suitable for the analytic sciences. This separation between the dynamic and the analytic leave a new area for development.
It is easy to think of the analysis of the physical sciences as being a static work, but from the previous discussion of the function Sin(x) it is clear that it is dynamic. These dynamic components are always in play and operate by intrinsic rules for each function or element, for instance whether to evaluate something numerically, symbolically or plotting graphically. Additionally many elements are evaluated at a time stable point, allowing a further dynamic component of temporality to be added to this mix.
The dynamic nature of this analysis has not been visually represented for physical sciences, to solve this issue a designed solution will have to be created. Fry asserts that “Design techniques for static information are well understood, their descriptions and discourse thorough and well-evolved. But these techniques fail when dynamic information is considered.”[24] Many of the rules of design associated with traditional media will fail if directly applied to this problem.
This new aesthetic must be able to communicate this dynamic nature without impinging on the ability to communicate the substance of the analysis. This view stems from Lewis’s[25] general statement on digital media’s aesthetic: “If an aesthetic native to the digital medium does exist, it must prove itself capable of communicating content of substance” although has been clarified for this particular application of digital media.
In the preceding section I discussed various methods for the visualization of applied mathematics and the relationship to the empirical process that this involves. It would seem clear that at present there is no system that both embodies a visual presentation of the mathematics coupled to the precise typographic analysis. It is also clear that the visual typographic style used to work with applied mathematics influences both the ease of use and the method that it is used.
It is my contention the producing a visual language for mathematics (in relation to the physical sciences) combining the two modalities: analysis and empiricism/visualization, will aid understanding and further extrapolation of relevant fields. To do this we need to establish some guidelines for the new language:
- Simplicity needs to be sustained.
The visual simplicity of the current typographic language should not be comprised when combining it with visualization techniques. The current language of mathematics is well defined and remarkably simple in terms of symbolism. This should not be lost.
- The dynamic nature of the language should be exploited before resorting to adding additional elements to make a visual technique.
As, discussed previously, elements of the language already have defined visual representations and so these should be relied upon before new ones are added. The differing nature of these representations can drive a new dynamic visualization. As a corollary to this, the temporal dynamic element should be used first when adding dynamism to the visual language when resorting to those outside of the intrinsic dynamism contained in the elements.
- The language needs to be flexible and extensible, both to itself and to users.
Early attempts at creating the visual tool of the periodic table for chemistry failed due to developing inflexible systems. Mendeleyev’s[26] periodic table was successful due to its ability to accept and change to new discoveries. We can tell from this example that creating a static system will fail with time as new discoveries and methods of thought are integrated.
- A compromise between pedagogical and expressive uses should not be made.
These are both aspects of the language that will feed into each other so it should not be developed to focus on one of them over the needs of the other. While in practice this may not be achievable it is worth having this as a rule to prevent the works being exclusively vied as, or developed for, purely visualization, pedagogical or analytical uses. By stating this guideline it is hoped that developers will be forced to think about the other domains when developing applications and therefore encouraging them not to force artificial concreteness while using them.
- Radical change should not be introduced for the sake of it.
Subtle effects will have greater chance of acceptance and visual clarity on a well defined language. This is not to say that a radical change of effect should never be used but only after careful thought and attempts to see if a more subtle change will produce the same effect.
4. SADI: an initial study.
SADI [Science and Art a Designed Interface] is an installation piece that consists of a camera linked to a projector so that a user or users are projected onto a surface in front of them at near 1 to 1 scale. Peripheral objects were placed around the instillation to draw uses into the projection environment, notably a description of the project was placed on a side requiring a user to walk in front of the video capture area to view it.
User motion & location is assessed and used to start, and adjust whilst running, a physics simulation. This simulation is shown graphically through dynamic typography, the subject of which is the mathematically based analysis of the physics simulation being run.
All images taken from SADI projections contained in this section were made during the group show You Are Here in Montreal, May 2005. Further images and videos are available from http://phud.net/htm/s/SADI.htm
![]()
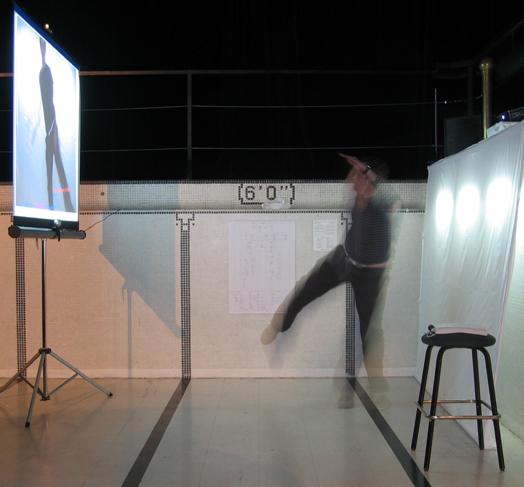
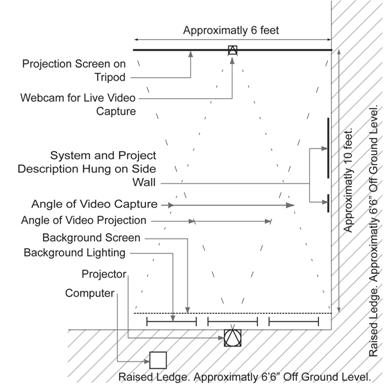
Figure 8. SADI Installed as Part of You Are Here - 2005.
Top is a view of SADI from the side with an active user. Left shows a floor plan of SADI as installed highlighting major parts and dimensions.
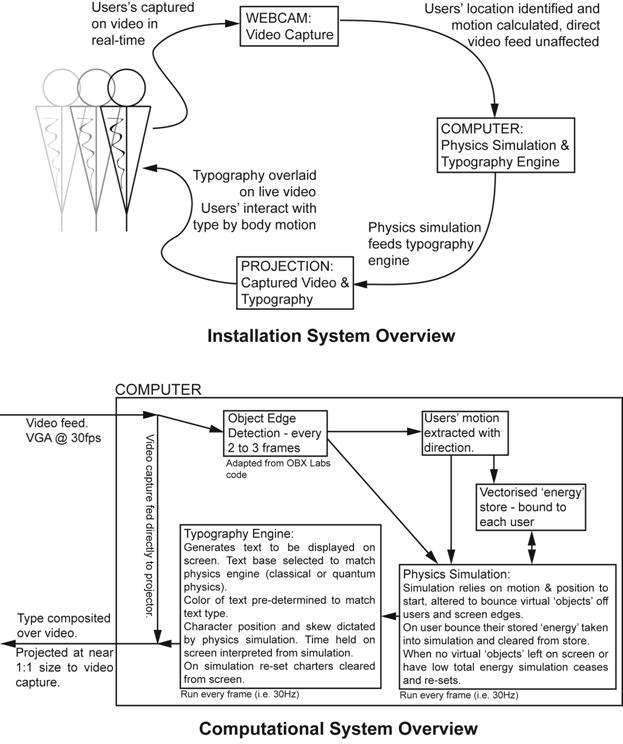
Figure 9. SADI Systems Overview.
This figure shows schematically the interaction and operating components of SADI.
4.1 Systems simulated and analyzed.
There are two fundamental types of simulation in SADI: classical/Newtonian mechanics and quantum mechanics. Simulation mode was selected at random with a bias towards quantum mechanics due to the short period of time the average quantum simulation would last.
The particle/object path is defined and shown by using dynamic typography to mathematically describe its own path. Green text is displayed to indicate any force interactions on the object, and for visual simplicity this is only shown when the particle is spawned. Red text is used to indicate energistic changes or inputs to the object. The object itself is either explicitly identified by black text, or in the case of classical mechanics, the predominant force on the object is shown to identify this virtual object.
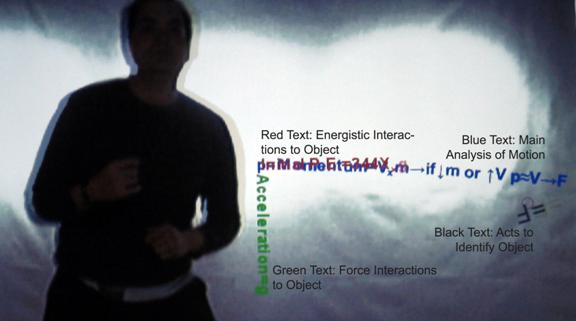
Figure 10. SADI: Text and Color Semantics.
This figure shows a projected image from SADI with color semantics highlighted. The smaller black text was added to the image after it was taken.
4.1.1 Classical/Newtonian simulation.
In this mode, the three Newtonian laws of motion were simulated on a virtual object generated by the user’s motion. This object then moves under these rules and bounces inelastically off people and the screen edge.
When the system total energy falls below a pre-set limit, due to collisions providing no additional energy, the simulation ceases and the program is re-set to allow for new input. The type displayed is both generic and specific. This means that it shows both generically the three laws of motion and their mathematical extrapolation, but it also shows the specific numerical system simulation.
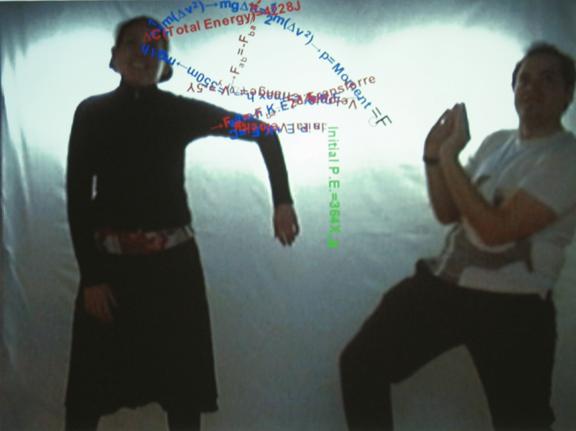
Figure 11. SADI in classical mode.
This is a picture of the projection of SADI when running a classical physics simulation. The parabola of the text arc is determined from simulating gravity of a virtual object denoted by the black text ‘F=’ and a small yellow circle. The effects of bouncing off users is also visible.
4.1.2 Quantum Mechanics.
For this system the simulation was limited to conversation of the mass energy relationship and to field equations. In a similar vein to the classical simulation a particle would be generated by the user motion although its path would be a single vector after creation. This particle would then break and form into multiple particles on hitting a boundary. If this was a person’s boundary their kinetic energy would be added to the total amount used to create the new particles.
When the particle breaks into new particles, the bounding interaction point would shrink to indicate that now new separations would be possible. Additionally, at this point a simulated weak magnetic field would be applied. This was done for both visual effect, but also to illustrate that something that can be very difficult to do experimentally can be simulated and described well.
The simulation would cease when the all the particles left the screen. This was selected to try and illustrate the very temporal nature of quantum mechanics experiments.
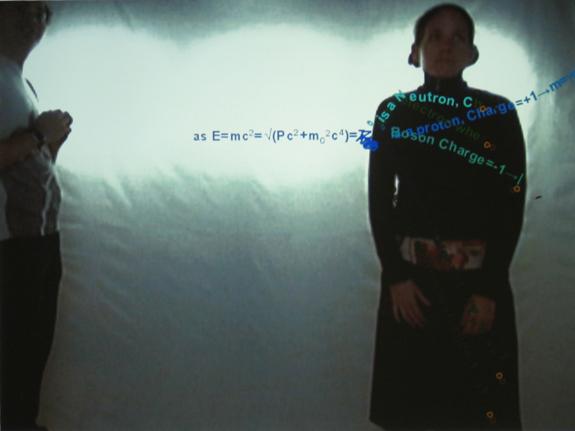
Figure 12. SADI in quantum mode.
A picture of the SADI projection when carrying out a quantum simulation. A particle has been emitted from the user on the left and has broken into five other particles on the user on the left. Some of these resultant particles have become trapped inside the body of the user on the right.
4.2 Interaction design.
One of the aims of SADI was to make the use of applied mathematics intuitive and, to some degree, tangible. With this in mind I decided to limit the level of interactions a user could perform to a minimum but keeping the interactions flexible in scope so that a user would not be bored using SADI.
With these precepts in mind the interaction was designed so that the generation of a new ‘particle/object’ system would be from user movement. This had a threshold attached to it that required a sharp movement from a user who is on the screen. Slow user motions would also be captured and stored so that if there has been sufficient movement and the user left the screen then it will generate a system at their last position. This store of ‘energy’ would be decremented with time to allow for slow movements to be made without affecting the physics simulation.
This ‘created’ object (classical or quantum) carries the momentum of the person who created it. That is to say that its speed and direction are both determined by how fast and in which direction the person moved to generate the object.
The other interaction differed if the system being modeled was for a classical object or for quantum particles. This was the ability for the objects to bounce off a person. When an object hits a person’s edge it bounces off at reflection angle (as determined by Snell’s Law) between the particle’s path and edge angle.
In classical mode, in addition to this bounce, the movement of the person(s) on screen would be tracked and between interactions and this movement (‘energy’) would be input into the path of the object when it hit a person’s edge. This would be added to the return bounce vector of the particle to the edge.
In the quantum simulation there is an additional single interaction possible. When the particle is created, it can break and split into other particles either on the edge of the screen or on the edge of a person. Before the particle breaks the movement of the people on the screen is tracked as in classical physics and if the break is against a person this ‘energy’ is then added to the total energy of the particle to calculate the new particle’s motion with. See section 4.1 for further discussion of physics model and implementation.
When coding the bounce at a person’s edge, a small bug was discovered, meaning that it would not always detect the person’s edge and therefore pass through it. This was left in the code, even though it would have been relatively simple to correct it, as it left a nice analogy for real interactions as it would require a substantial movement from a person to release this object from within them.
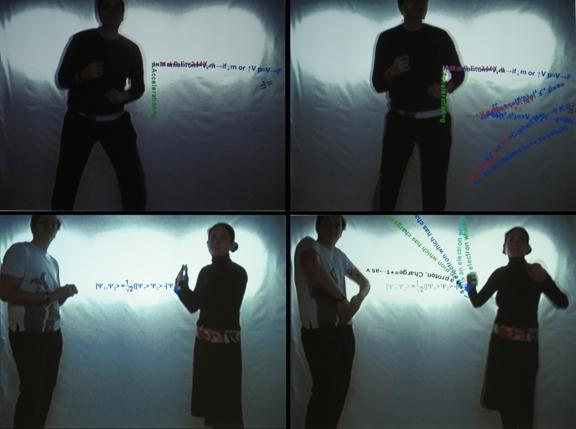
Figure 13. SADI interactions.
These images were taken from SADI projections. The top row is in classical physics mode, the bottom row is in quantum physics mode. Top left shows a classical object being produced from the users motion. Top right shows this same simulation a few seconds later after the object has bounced off both the sides and the user several times, at each bounce off the user an amount of the users’ motion between bounces is taken and input into the physics simulation as to affect its results.
Bottom left shows a particle created, in quantum mode, from the user on the left about to hit the hand of the user on the right. Bottom right shows the same simulation a few seconds later after the particles has broken into multiple particles. One of these particles has returned to the user on the left and is about to bounce off of him.
4.3 Typography and SADI
It is important to place SADI in its context of dynamic typography works. One of the aspects of this program is that the text is displayed on screen for a relatively short period of time (each character has a maximum rendering time of approximately 9 seconds, of which 3 will be at 0% transparency and then fading to 100% transparency over the remaining period). Previous studies on rapidly displayed text, or Rapid Serial Visual Presentation (RSVP), indicate that a very large number of English words can be read in a short period of display.
Cho[27] conducted a brief survey of RSVP projects in his master’s thesis and states “RSVP suggests that readers can absorb text rapidly when the focal point is fixed and text is displayed serially, word by word.” Speedreader[28], for instance, attained a legible readability of 2000 words per minute or 33 words a second. Larson[29] indicates that the role of word letters predominates over the shape of the word in recognition during reading.
Compared to English Prose the semantic relationship between the symbols and their layout location of a mathematical text is far more complex. Take, for instance, the two identities 1/x and x-1 both represent the same variable relationship but have a substantially different layout and character composition. Mathematical texts rely on a spatial relationship that instead of being based on a single baseline can effectively spread across 5 standard lines of text[†], more for very complicated equations. All of this will prevent rapid assimilation by a user in the way that can be achieved though RSVP.
While the techniques of RSVP my not directly apply to this kind of text, it is reasonable to use this principal to say that an experienced user of SADI will be able to read substantial portions of the text due to their familiarity with it. A novice user, on the other hand, will be able to recognize or read key points but not necessarily follow the full analysis. This allows a novice user to gain an experience of some of the more complex and subtle issue involved in the subject matter.
Creating SADI in this way allows for a wider user base, giving a different experience to users with differing levels of experience. A rank novice user would be expected to recognize some of the English textual parts and directly infer a relationship to the objects on a screen. An intermediate user, say someone that studies math or physics though to the end of high school, would be able to couple the English text to some of the mathematical elements. An expert user, someone who studied these topics through a bachelor’s degree or higher, would then be able to follow the full analysis and view this alongside its visual depiction.
This relationship stems from being able to read the key points and directly see their relationship to the particle or object, thus bypassing the need to fully explore the field to get to this point of understanding. For the more experienced user SADI offers an intriguing new modality to examine the quantized analysis of these physical simulations.
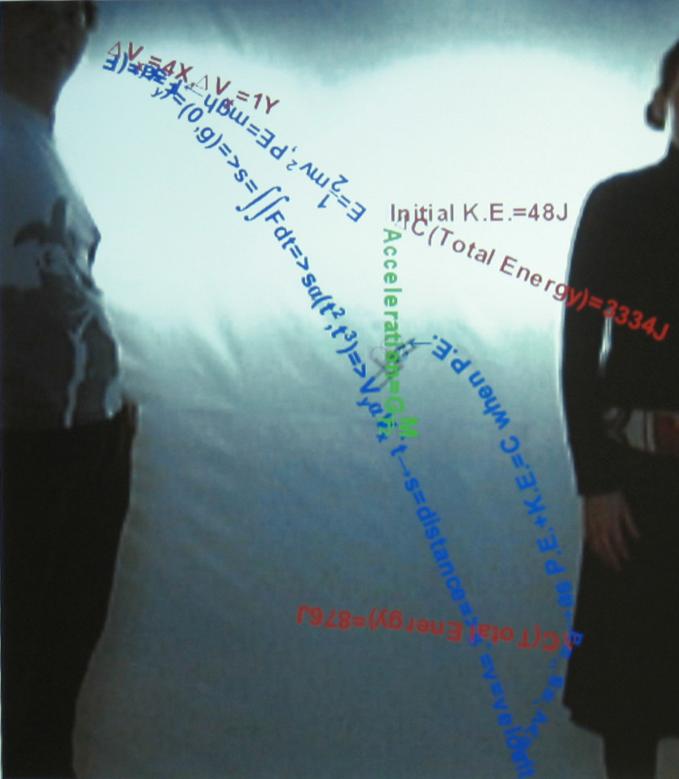
Figure 14. SADI’s Typography.
Cropped projection image from SADI. Image has been clarified to show the type being produced by the dynamic typography engine.
5. Analysis of SADI.
From a technical and mechanical point of view SADI was a great success. People were witnessed interacting with the system without any prior information with the average usage time being approximately 5 minutes but ranging from 30 seconds to half an hour. It was clear that the small latency in the system was soon forgotten by most users (after between 1-2 minutes of use), additionally most users became immersed in the computational environment ignoring unrelated activities peripheral to SADI.
Full quantative assessments, involving user studies and questionnaires were not performed as SADI was demonstrated as a proof of concept prototype. Therefore this section will deal with a qualitative evaluation of SADI. For a quantative analysis a test of the user’s abilities would have to be performed before and after using SADI. This test would have to be designed to be open in structure to evaluate both low and high level skills in the subject and would also be likely to involve essay style qualitative questions. To design a test that would satisfy these criteria, and not bias a user of SADI, is a substantial task in itself.
To analyze SADI in relation to the 5 rules postulated in section 3:
1 – Simplicity. The visual language of applied mathematics was retained and augmented slightly by applying an additional skew and offset related to the previously rendered characters position. Great efforts were made in the programming to ensure an automatic layout of characters to match a traditional layout system like TeX.
2 – Dynamism. In this case an energy was numerically taken into the system and then the dynamic nature of the system with relation to time was simulated and animated. It is arguable whether time is an additional factor added to the system to be evaluated as it is quite possible for these kinds of systems to have multiple analyses based upon a time expansion from an initial point. Usually with time expansions, evaluations are taken at discrete points that tend to be critical, in this case the evaluation is more continues to cover intermediate steps. The complexity of the systems modeled prevented any simplistic analysis to be performed.
3 – Flexibility and extensibility. In terms of user function it was designed to be both flexible and extensible, see discussion in section 4.3.
4 – All purpose design. This is perhaps where SADI conforms weakest to the rules. This is due to the computational architecture and a desire on the interaction side to be open and easily accessible. Making the system accessible prevents easy reassignment of the physics model without access to the program code. The foundation of SADI, the dynamic typography engine, can be re-interpreted given a new physics model to work in conjunction with but it falls halfway from a presentation program to a analysis program (see section 2.2.1).
5 - Radical change. The largest change to the typography system over traditional methods is the introduction of a color scheme to the text. This was done after studying the effects of giving a clear visual clue as to the nature of what the text is describing and separating it into the 4 generic groups. The use of this color scheme makes the textual description of certain rendered text far smaller as with the color semantics certain information can be automatically derived.
As a complete system for a new visual language, as proposed, SADI leaves a lot to be desired. As a presentation of potential aspects of it and a defined prototype for areas relating to specific physical applications it fulfills its functions well. Using a live video feed gave an immediate presence of a user into the system making it open and clear to use. The use of a live video feed also limits the ability for this to be a universal tool, although most modern consumer computers will be able to execute the code well and therefore there is potential for a wide-scale audience for this prototype.
6. Conclusions and future work.
There are two strands to this discussion: conclusions about the framework for a new visual language as proposed and a further discussion regarding conclusions that can be drawn from SADI and its applications to this language. In the previous sections I have outlined deficiencies in both the traditional methods of using and describing analytical sciences and the modern tools used to work with the analytical mathematics in terms of simulation and presentation.
It is clear from this analysis that the methods currently used lose elements of the situation being examined depending upon which modality is used to analyze it; an analogy would be that you can look at an object or feel it but can’t do both at the same time. This has serious issues in relation to both pedagogical and epistemological aspects throughout the areas of analytical/numerical sciences. As shown from the development of calculus it is not just the concept but also its representation play a major impact on how it is developed and used.
The mathematical notation has been largely developed on an ad hoc basis. While this has been flexible enough to allow for modern developments in these fields, there is often little cohesion between different operators or visual link of these symbols to the function they describe. Developing a new mode to display these concepts should allow for better understanding of them, making a greater sensory link to them instead of developing this view through combining the two modes together mentally.
One of the advantages of the new computational architectures is that they often have enough spare capacity to do complex visual effects while still running the standard applications that an advanced user requires. This allows for this kind of visual structure to be added to existing platforms without loss of fidelity. Additionally, this computational power allows for real time simulation and media manipulation based upon traditional mathematical analyses of physical systems.
One of the problems of introducing a new language to the scientific community is that it tends to be both conservative and firmly in the side of “first come, first served”, at least when it comes to the presentation of work. One of the aim’s of SADI is to shock and awe people with the idea of how these concepts can be re-interpreted in the framework that I have proposed, and therefore attempt to show that there are other viable ways to process and present these concepts that have a closer affinity to the objects they describe.
While SADI demonstrates a possible proposal for how to achieve this new modality, it is a very visual system and this has some drawback to wider usage. Principally that it relies on a live video feed, limiting its applications and secondly it relies on a pre-programmed simulation system so limiting its scope.
To achieve the new visual language that I have outlined and partially demonstrated with SADI there are several steps that need to be made. At the moment I have focused on the fields of applied mathematics and physics based applications this new language needs to extend to chemistry and possibly engineering as well. The field of biology, apart from certain specialized areas, is unlikely to be incorporated into this system due to the fundamentally different methods that are often used in both analytical and empirical areas.
More studies need to made, along the lines of SADI, to see how these principles can be interpreted in the different areas and different methods of interaction. These need to be of a substantial number to significantly explore the basic different ways of interpretation to ensure that the best are carried through. This should be done with as wide group as possible to encourage a consensus to be made to help later uptake of this system. These studies will then be used to form the basis of the new language to allow for full development into a cohesive system with different tool based applications.
Appendix A: SADI - Technical description.
A.1 Software.
SADI is written in Java and consists of approximately 15,000 lines of code developed specifically for this project. Webcam data stream is captured for Java by JMF (Java Media Framework) because in our experiments it appeared that JMF was the fastest way of digitizing a video stream to Java on x86 architecture. The digitization of the image induced a small delay of approximately 100ms. Java 1.5 was used to run the program (windows 32-bit version).
Using a variation of OBX Labs code, object edges are determined by luminosity with an optional reference frame taken to improve accuracy. Object motion is calculated by the moment of the extremes of each objects boundary on the screen.
Text is drawn using Java 2D with character position and skew determined from the physical simulation being run. The physical simulation and typography engine were written for this project and allow for further re-implementation.
A.1.1 Font face selection.
The san-serif font Arial was used to display all standard Latin characters and the serifed font Times New Roman was selected to display all Greek and scientific characters. The choice of a san-serifed font for the bulk of the text was made as there has been substantial research to indicate that for rapid text visualization a san-serifed font allows for faster reading.
The split to a serifed font for the Greek and scientific characters was made due to the lack of visual clarity and range of characters available on most san-serif fonts. For instance the Greek lower case letter gamma visually looks like a capital Latin Y when using Arial. This would have caused confusion without the separation of fonts.
All text was rendered as anti-aliased to improve the visual clarity of the text; this was especially significant for text being rendered at angles significantly different from orthogonal.
A.2 Hardware.
A webcam was used for video capture. This would capture a VGA image (640x480 pixels) at a maximum of 30fps. Fixed exposure and white balance was selected to ensure that camera was not adaptive during the performance and therefore not interfere with object detection.
The computer used in the instillation had a 3400+ AMD Athelon CPU, 1GB ram and an nVidia GeForce 5200 (128mb) video card. It was run in tests on a lower specification machine with slightly lower frame rates.
The projector used digitally zoomed and cropped an SVGA output from the computer to a VGA projection at 2,500 ANSI lumens. This provided a bright borderless image on the projection screen mounted approximately 10 feet in front of the projector.
A.2.1 Background illumination.
The system as designed will work with any background set up but is optimized for a even bright surface or backdrop. As space allocation was limited, we relied on a physical backdrop to capture video against which was back lit by three fluorescent lights to allow for high contrast between an object in front of the backdrop and the backdrop.
The reflected light from the projection screen was sufficient to allow for the video display of full skin tone, and allow for facial expressions to be recognized by the user.
A.3 Technical & implementation issues.
As with most systems that involve computational manipulation of live video; latency was a major issue through out the implementation of SADI. The two most computationally intensive tasks were a) calculating the object edges from the video feed and b) rendering text to the screen. Each of these tasks comprised about 37 percent of the computational load, leaving the approximately 20 percent load to handle running of the OS, webcam and physics model.
To reduce the latency associated with edge detection, the operation was only performed every roughly 2-3 frames. The edges were then held over in the computational cycle to be used for subsequent displayed frames where edge detection was not carried out.
The most obvious limitations to the system came through the control of the latency from the text display. For this, I limited the amount of time that a character could be drawn on the screen. More importantly, it was limited to modeling a single classical particle and, in the quantum physics simulation, to being able to break into only a maximum of seven new particles. Even with these restrictions there would often be in excess of 500 characters on screen, each drawn at an individual angle and transparency.
Appendix B: References and Citations
[*] See next section for further details and citation.
[†] For example: ![]() ,
, ![]() ,
, ![]() ,
, ![]() ,
, ![]() ,
, ![]() ,
, ![]()
[1] Rand, Paul; “A Designers Art”; pp48, Yale University Press, 1985 (re-printed 2000).
[2] Maeda, John; “Design By Numbers”; pp235, MIT Press, 1999.
[3] Feynman, R.; “Space-time approach to quantum electrodynamics.” Phys. Rev. 76: 769-789, 1945.
[4] Lewis, Jason E.; “Dynamic Poetry, Introductory Remarks to a Digital Medium”. Masters Thesis, Royal College of Art, 1996.
[5] US Patent and Trade Mark Office, Pat. No. 3,120,606, 1947.
[6] Knuth, Donald E; “The TeXbook”, American Mathematical Society & Addison-Wesley, 1984
[7] LaTeX project: http://www.latex-project.org/
[8] Sha, Xin Wei; "Differential Geometric Performance and the Technologies of Writing." Pp12, Ph.D. Dissertation, Stanford University, 2000.
[9] Houghton, Filho, Griggs & Maskell; “An Introduction to Simple Climate Models used in the IPCC Second Assessment Report - IPCC Technical Paper II”. IPCC Working Group I, 1997.
[10] Met Office; “Environmental Prediction. Science and Technology in the Met Office 2003 – 2004”, Met Office (Crown Copyrigt), 2004.
[11] Sha, Xin Wei; "Differential Geometric Performance and the Technologies of Writing." Ph.D. Dissertation, Stanford University, 2000.
[12] Chak, D; “Enhanced Modelling: real-time simulation of graph based problems on interactive workbenches”, Masters Thesis, MIT, 2004
[13] Patten et al; “Sensetable: a wireless Object tracking platform for tangible user interfaces”, Proceedings of CHI 2001, March 31 – April 5 2001, ACM Press.
[14] Zuckman, O; “System Blocks: Learning about Systems Concepts through Hands-on Modeling and Simulation”, Masters thesis, p28, MIT Media Lab, 2004.
[15] Stewart, James; “Calculus – Early Transcendentals”, p118, Broks/Cole Publishing Company, London, UK. 1995.
[16] Gillet A, Sanner M, Stoffler D, and Olson A; "Tangible Interfaces for Structural Molecular Biology " Structure 2005: 13 p483–491
[17] Gillet A, Sanner M, Stoffler D, and Olson A; "Tangible Augmented Interfaces for Structural Molecular Biology" IEEE Computer Graphics and Applications March 2005 p13-17
[18] Gillet A, Sanner M, Stoffler D., Goodsell D and Olson A; "Augmented Reality with Tangible Auto-Fabricated Models For Molecular Biology Applications." In proceeding of IEEE Visualization 2004, Austin, Tx, p235-241
[19] H. Kato, M. Billinghurst, and I. Poupyrev. “ARToolKit User Manual, Version 2.33”. Human Interface Technology Lab, University of Washington, 2000.
[20] Kato, H., Billinghurst, M., Asano, K., Tachibana, K, “An Augmented Reality System and its Calibration based on Marker Tracking” Journal of the Japanese Virtual Reality Society, Jan 2000.
[21] Fry, Benjamin; “Genomic Cartography”, MIT Media Lab, 2002.
[22] Wolfram, Stephen; “A New Kind of Science”, Chapter 9, Wolfram Media Inc, 2002.
[23] Gardner, M; “Mathematical Games: The fantastic combinations of John Conway’s new solitaire game “Life””, Scientific American 223, pp120-123, October 1970.
[24] Fry, Benjamin; “Organic Information Design”, pp3, Masters Thesis, MIT Media Lab, 2000.
[25] Lewis, Jason E.; “Dynamic Poetry, Introductory Remarks to a Digital Medium”, pp34. Masters Thesis, Royal College of Art, 1996.
[26] Mendeleev, D.; “The Periodic Law of the Chemical Elements”, The Chemical News and Journal of Physical Science 40, 78–79. 1879
[27] Cho, P; “Computational Models for Expressive Dimensional Typography”. Masters Thesis. P24, MIT 1999.
[28] Back, Maribeth, Cohen, J., Gold, R., Harrison, S., Minneman, S; "Speeder Reader: An Experiment in the Future of Reading." Computers and Graphics, Vol. 26 (3), June 2002.
[29] Larson, K; “The Science of Word Recognition.” Advanced Reading Technology, Microsoft Cooperation, 2004.
--
This site is best viewed through I.E. V6 with a screen resolution of at least 1,024 x 768.
High speed internet connection preferred.
Adobe Acrobat Reader is required to view this site. If you do not have it it can be installed from here.
Macromedia Flash Player 7 is required to view this site. It is downloadable here.
All works are copyright Meredith Davey.
Pieces in this
category
SADI
of a Manifesto